I spent my first year betting on NFL games without once checking whether the odds I was getting were good. I knew what 5/1 meant. I knew what 2/1 meant. What I did not know was that those numbers were a language, and that learning to translate between languages – fractional, decimal, American – would eventually become one of the most practical edges in my entire approach.
Sports betting forms the largest revenue segment in the UK gambling industry, accounting for over 56% of market share. Within that segment, every pound wagered is priced through odds, and every odds format tells you the same thing in a different dialect: how likely the bookmaker thinks an outcome is, and how much they are charging you for the privilege of disagreeing. This guide walks through all three formats using one consistent NFL example so you can compare them side by side, convert between them fluently and – most importantly – spot where the bookmaker’s price diverges from the true probability.
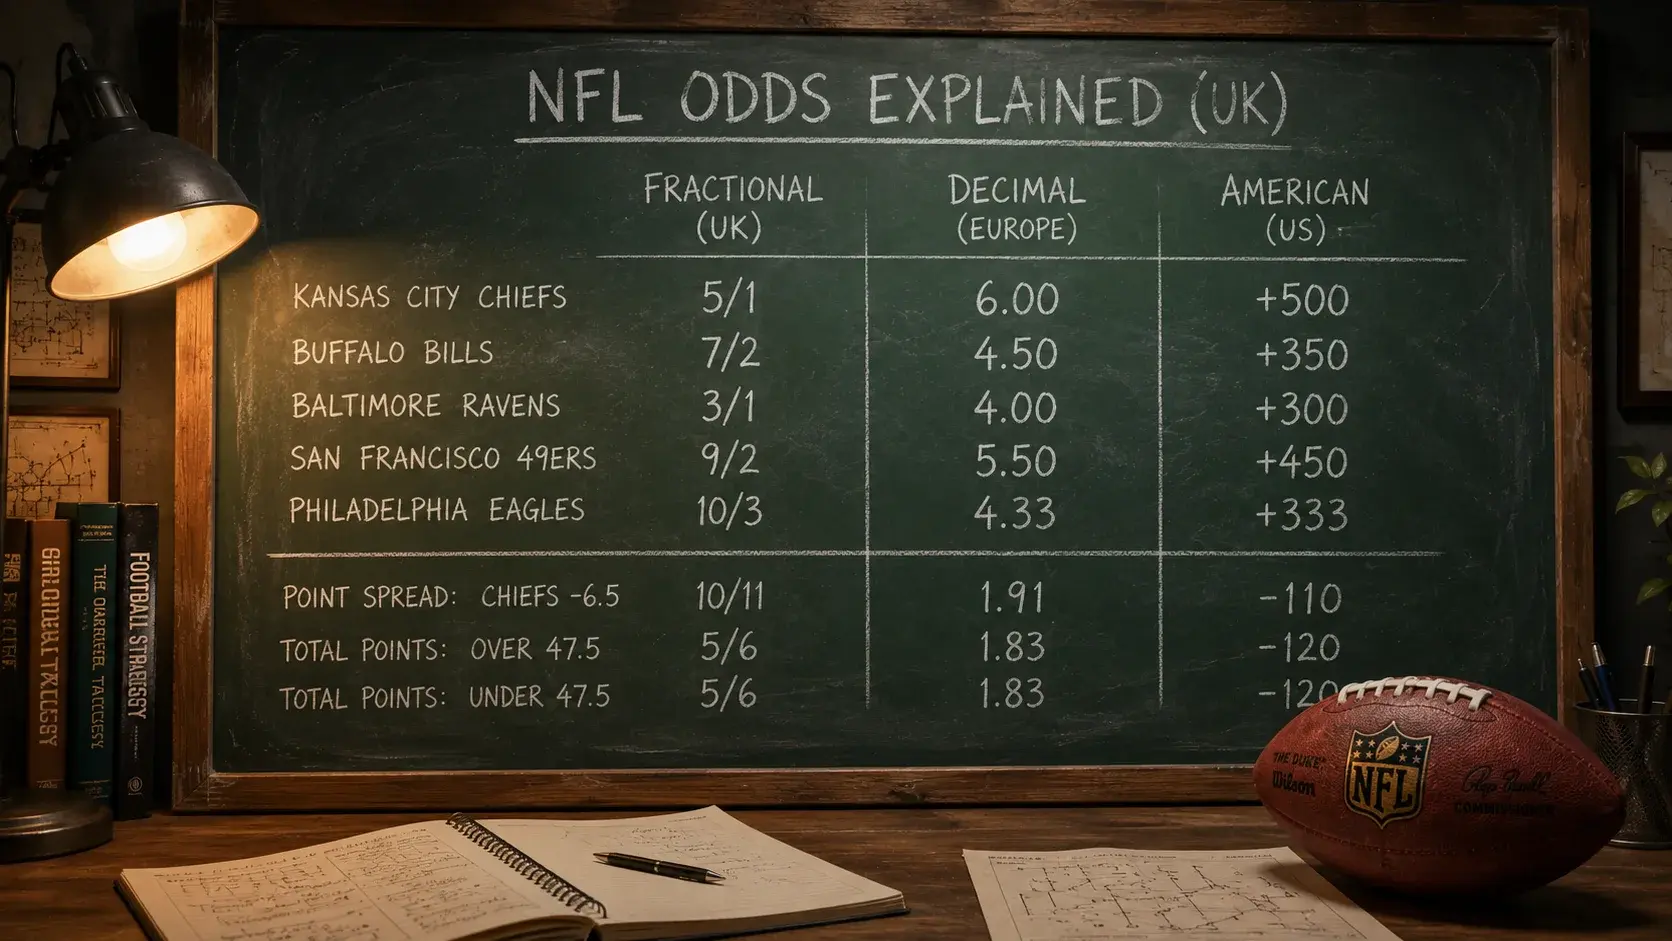
Fractional Odds: The UK Default for NFL Markets
If you grew up betting on the Grand National or the Premier League, fractional odds are wired into your nervous system. Five to one means you win five pounds for every one pound staked. Two to one means two for one. Even money means your profit equals your stake. The format is intuitive because it describes the payoff as a ratio, and that ratio is immediately graspable without any arithmetic.
Let me use a single NFL fixture to anchor every format in this guide. Imagine a Week 10 matchup: the Buffalo Bills are favoured against the Miami Dolphins. A UK bookmaker might price the Bills moneyline at 4/9 and the Dolphins at 7/4. At 4/9, you stake nine pounds to win four – a total return of thirteen pounds. At 7/4, you stake four pounds to win seven – a total return of eleven. The smaller the fraction, the heavier the favourite. The larger the fraction, the longer the shot.
Where fractional odds become cumbersome is at short prices and unusual intervals. A price of 10/11 is common on NFL spread bets, and mentally converting that into a return is not instant for most people. Even worse are fractions like 8/13 or 4/7, which appear routinely on NFL favourites and require genuine arithmetic to evaluate. When I started tracking my NFL bets seriously – logging every stake, price and return in a spreadsheet – I switched to decimal format within a fortnight simply because fractional odds slowed down my calculations.
That said, fractional odds remain the default display at most UK bookmakers for a reason: tradition, familiarity and the fact that they communicate the profit cleanly. If you are a casual punter placing one or two NFL bets per week, fractional is fine. If you are comparing prices across multiple bookmakers and calculating expected value, you will want to become fluent in decimal or American as well – not because fractional is wrong, but because it is slower.
One quirk worth noting: UK bookmakers occasionally display fractional odds that look different but represent the same price. You might see 4/6 at one operator and 2/3 at another. These are mathematically identical, but the visual difference can confuse a quick comparison. Some platforms simplify fractions automatically, others do not. If you are line-shopping across multiple sites in fractional format – which I do not recommend, but which many UK punters default to – double-check that you are comparing equivalent prices before assuming one is better than another.
Decimal Odds: The European Alternative
Decimal odds answer the simplest possible question: if I bet one pound, what is my total return including my stake? No ratios, no mental gymnastics – just a single number that you multiply by your stake to get the total payout.
Back to our Bills-Dolphins example. The Bills at 4/9 fractional translate to 1.44 decimal. Stake ten pounds, total return is fourteen pounds forty. The Dolphins at 7/4 translate to 2.75. Stake ten pounds, total return is twenty-seven pounds fifty. Decimal format is dominant across Continental Europe, widely used in Scandinavia and increasingly popular in the UK among younger bettors who find it more logical.
The real advantage of decimal odds is comparative speed. Imagine you are scanning five bookmakers for the best Bills moneyline price. One shows 4/9, another 2/5, a third 40/85 (yes, some platforms produce fractions this ugly), a fourth 1.44 and a fifth 1.40. In fractional, ranking those prices requires converting each to a common format in your head. In decimal, the ranking is immediate: 1.44 is better than 1.40. Done.
For NFL betting specifically, where I often compare prices on spread markets across three or four platforms before placing a bet, decimal format saves minutes per decision. Over a full Sunday slate of eight games with multiple potential bets per game, those minutes add up. I set every bookmaker account to decimal display by default and only switch to fractional when the platform does not offer the option. The calculation for expected value – decimal odds multiplied by estimated win probability, minus one – is trivially simple in decimal and annoyingly fiddly in fractional.
American Odds: Reading the Format US Sportsbooks Use
The first time I opened a US sportsbook and saw “-225” next to a team name, I thought the interface had glitched. American odds look alien to anyone raised on fractional pricing, but the underlying logic is clean once you crack the code. The format uses a baseline of 100 and tells you either how much you must stake to win 100, or how much you win on a 100-unit stake.
Negative numbers indicate the favourite. Bills at -225 means you must wager 225 dollars to win 100 dollars in profit. Positive numbers indicate the underdog. Dolphins at +175 means a 100-dollar wager returns 175 dollars in profit. The further the number from zero in either direction, the more extreme the price – a -500 favourite is very heavily fancied, while a +500 underdog is a significant long shot.
Why should a UK punter care about American odds? Because the NFL is an American sport, and the sharpest pricing data, the line-movement trackers, the public betting percentage tools – all of it is published in American format. If you follow NFL betting analysis from US-based sources (and you should, because that is where the deepest analytical ecosystem lives), you need to read -110 as naturally as you read 10/11. US sports betting revenue hit $16.96 billion in 2025, growing nearly 23% year on year, and the analytical infrastructure that supports that volume is unmatched anywhere in the world. Locking yourself out of it by refusing to learn the format is a self-imposed handicap.
Our Bills-Dolphins match in American format: Bills -225, Dolphins +175. These correspond to the fractional and decimal equivalents already covered – 4/9 or 1.44 for the Bills, 7/4 or 2.75 for the Dolphins. Same bet, same payout, different label. The format you read in does not change the value of the bet. But the format you think in can change how quickly you spot that value.
Converting Between All Three Formats
I keep a conversion cheat sheet taped to the wall above my desk. Not because the maths is hard, but because under time pressure – say, a line is moving and I need to compare a UK price with a US tracker price before the market settles – I do not want to waste ten seconds on arithmetic. Here are the conversions I use most often, each applied to our Bills-Dolphins example.
Fractional to decimal: divide the numerator by the denominator and add one. Bills at 4/9: (4 / 9) + 1 = 1.44. Dolphins at 7/4: (7 / 4) + 1 = 2.75. This is the conversion I use most frequently because it feeds directly into expected-value calculations.
Decimal to fractional: subtract one, then express as a fraction. Bills at 1.44: 1.44 – 1 = 0.44, which simplifies to 4/9. Dolphins at 2.75: 2.75 – 1 = 1.75, which simplifies to 7/4. In practice, some decimals produce ugly fractions – 1.91 becomes roughly 10/11 but not exactly, and bookmakers round to the nearest standard fraction. That rounding can create tiny pricing discrepancies between the fractional and decimal displays on the same platform.
American to decimal: for negative odds, divide 100 by the absolute value of the American number and add one. Bills at -225: (100 / 225) + 1 = 1.44. For positive odds, divide the American number by 100 and add one. Dolphins at +175: (175 / 100) + 1 = 2.75. This is the conversion you will use most when reading US line trackers and translating them into a format that matches your UK bookmaker display.
Decimal to American: if the decimal is below 2.00 (favourite), the American odds are -(100 / (decimal – 1)). Bills at 1.44: -(100 / 0.44) = -227, rounded to -225 in standard pricing. If the decimal is 2.00 or above (underdog or even), the American odds are (decimal – 1) x 100. Dolphins at 2.75: 1.75 x 100 = +175.
The fractional-to-American conversion is clumsier and I generally avoid it by going through decimal as an intermediary step. Fractional to decimal first, then decimal to American. Two simple operations instead of one confusing one. After a few weeks of practice, these conversions become automatic, and you stop thinking about format entirely – which is the goal. The format should be invisible. The price is what matters.
Implied Probability and the Overround
Every odds price has a hidden message: this is how likely we think this outcome is, plus a tax for our trouble. Extracting that message – the implied probability – is where odds literacy becomes a genuine betting tool rather than a display preference.
The formula is straightforward in decimal: implied probability equals one divided by the decimal odds. Bills at 1.44: 1 / 1.44 = 69.4%. Dolphins at 2.75: 1 / 2.75 = 36.4%. Add those together: 69.4% + 36.4% = 105.8%. In a fair market, the two probabilities would sum to exactly 100%. The excess – 5.8 percentage points – is the overround, the bookmaker’s built-in margin.
The overround varies by bookmaker, by sport and by market. On NFL spread bets at a competitive UK operator, the overround typically sits between 4% and 6%. On NFL prop markets, it can balloon to 8-12% because the pricing is less precise and the bookmaker needs a wider cushion. The global sports betting market was valued at roughly $125 billion in 2026, and the overround is the engine that keeps the entire industry profitable. Understanding it does not eliminate it, but it tells you exactly how much you are paying to play – and it lets you compare costs between operators.
I calculate implied probability for every bet I consider. If my own model or analysis suggests a team has a 60% chance of covering the spread, and the implied probability from the odds is 52.4% (standard -110 juice), then I have a positive expected value of roughly 7.6 percentage points. That is a strong bet. If my estimated probability is 54% against the same 52.4% implied probability, the edge is thinner – 1.6 points – and I might pass unless other factors support it. The full map of NFL betting markets covers how this logic applies differently depending on the type of wager.
The overround is not a conspiracy – it is a price. Like any price, it can be negotiated by shopping. If one bookmaker’s overround on an NFL match is 106% and another’s is 104%, the second is giving you a better deal on the same product. Over hundreds of bets across a season, that two-point difference in overround translates into a meaningful improvement in your long-term return. Line shopping is boring. It is also the closest thing to free money in sports betting.
Where to Find the Sharpest NFL Odds in the UK
Gavin Wood, the CEO of Entain – the group behind Ladbrokes and Coral – said in 2025 that the company sees opportunities to outperform market growth in the UK as it continues recovering market share. When the second-largest operator in the country is publicly fighting for share, the beneficiary is you, the punter. Competition between operators compresses margins, and compressed margins mean better odds.
The UK’s bookmaker landscape for NFL is dominated by a handful of large groups. Flutter Entertainment, which operates several major brands, led the market with projected UK revenue above two billion pounds in 2025. Entain followed at just over two billion. Below them, a tier of mid-sized operators – some with US parent companies bringing NFL-specific expertise – rounds out the competitive field. The practical consequence of this structure is that no single bookmaker consistently offers the best NFL odds across all markets. The sharpest price on a Bills moneyline might be at one operator, while the tightest spread overround for the same game sits at another.
I maintain accounts with at least four UK bookmakers specifically for NFL betting, and I check prices on all four before placing any stake above my minimum unit. The process takes under two minutes per bet and has saved me more money over the years than any single analytical insight. If you only have one account, you are accepting whatever margin that bookmaker sets without competition. That is the most expensive habit in sports betting, and it costs you nothing to break.
Betting exchanges deserve a mention here because their commission-based model means they do not build an overround into the odds. Exchange NFL markets in the UK tend to be thinner than fixed-odds markets, which means you may not always find liquidity at your preferred price. But for popular fixtures – Sunday Night Football, Monday Night Football, playoff games – exchange liquidity is often sufficient, and the effective margin after commission is typically lower than the best fixed-odds alternative. I use exchanges as a benchmark: if the exchange price implies a probability significantly different from the fixed-odds price, one of them is wrong, and that discrepancy is worth investigating.
How Odds Differ Across NFL Bet Types
Not all NFL odds are created equal, and the market type determines the margin you are paying. Spread bets carry the tightest overrounds because they attract the highest volume and the most sophisticated money. Moneyline markets on lopsided matchups carry wider margins on the favourite side because the bookmaker needs protection against large liabilities on a near-certain outcome. Totals markets sit somewhere in between – popular enough to be competitively priced but less heavily traded than spreads.
Prop markets are where the margin widens most dramatically. A player prop on rushing yards might carry an implied overround of 10% or more, compared to 5% on the same game’s spread. The reason is data scarcity: bookmakers have decades of data on team-level outcomes but far less on individual player performance in specific game contexts. That uncertainty gets priced into the odds as a wider margin, which is the bookmaker’s way of saying “we are less sure about this, so we are charging you more.”
Futures markets – Super Bowl winner, conference champions, MVP – carry the widest margins of all because the uncertainty horizon is the longest and the bookmaker’s capital is tied up for months. A Super Bowl futures book with 32 teams might have a combined overround above 140%, meaning the bookmaker’s margin is 40 percentage points or more. That is an enormous cost to the bettor, and it is why I approach futures markets with extreme selectivity. The potential payouts look attractive, but the price you are paying for that potential is steeper than it appears.
Understanding these margin gradients helps you allocate your NFL betting capital more efficiently. If you are a volume bettor placing multiple bets per week, concentrating on spread and moneyline markets – where margins are lowest – will reduce the drag on your bankroll over time. If you enjoy props and futures for entertainment, that is fine, but be honest with yourself about the cost of entry. The odds format does not change the margin. The market type does.
Reading the Price Before You Pay It
Odds are a language. Learn to read them in all three dialects and you gain access to the entire global NFL betting conversation – the US line trackers, the European exchanges, the UK high-street bookmakers. More importantly, you gain the ability to calculate what you are really paying every time you place a bet. The punters who treat odds as a price to be analysed, rather than a number to be accepted, are the ones who last longer than a single season.